7 · The number Draft
Reading a flame graph and finding the tail
On this page
The flame graph
A list of functions and percentages hides which callers the time came through. A flame graph, Brendan Gregg’s picture of sampled stacks, shows it. It is made in three steps: perf script prints every sample with its stack; inferno-collapse-perf folds each stack into one line, the function names joined by semicolons and followed by the number of samples that had exactly that stack; and inferno-flamegraph draws the folded lines as an SVG. inferno, installed with cargo install inferno, is a Rust port of Gregg’s scripts; cargo flamegraph, from the flamegraph crate, runs all three steps around a build.
Each box is a function at one position in a stack. The bottom row is the thread’s entry, each box sits on the function that called it, and the top edge of each tower is the function that was running when the sample was taken. A box’s width is the share of all samples whose stack passed through it there, so it includes everything it called. The x-axis is not time: each row is sorted alphabetically so that identical stacks merge into one wide box, and left to right means nothing, nor do the colours. Read the flat tops: where a box is wider than everything stacked on it, the difference is time spent in its own instructions, and the widest flat tops are where the CPU spends itself.
Here is the strategy thread of the capstone’s default build in a flat run, to scale, 80 columns for all its samples:
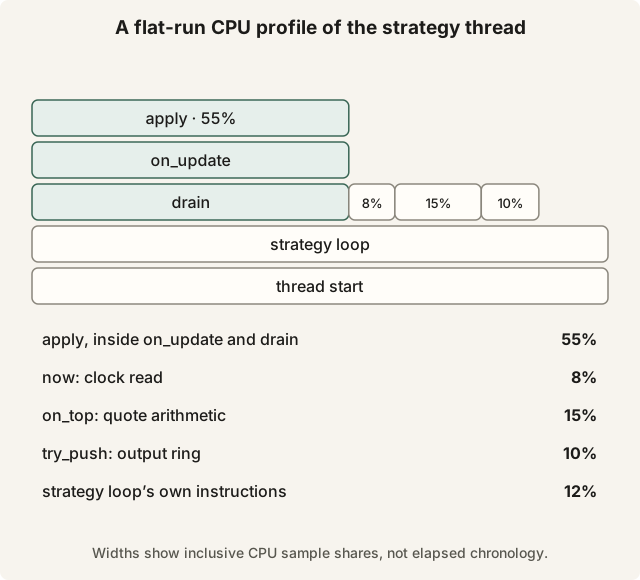
A flat-run CPU profile of the strategy thread. Select the diagram to open it at full size.
apply is the widest flat top: the book is the work, as expected. drain and the feed handler’s on_update are almost exactly as wide, so their own instructions, the pop, the sequence check and the test of the handler’s state, are too few to show. on_top runs once per batch and does arithmetic. try_push writes an order slot that the gateway on core 6 last read, so the line must first come back from core 6, the price of a separate gateway. now is the one clock read per batch that ends think and total; its 8% is a share of the work, not of the 1 µs budget, and in the stages build, with a read for every message, it grows to a third of the loop, as the ladder of a measurement predicted. The loop’s own 12% is the top compare, the batch bookkeeping and the histogram records, inlined into it.
Nothing here is unexpected, and confirming that is what a flame graph is for. The news would be __rust_alloc, malloc or free, memory allocated in the loop, as the --book tree swap shows; memcpy or memmove, data being moved; anything from core::panicking; and kernel functions such as entry_SYSCALL_64, where every system call enters, or asm_exc_page_fault. inferno-diff-folded compares two folded files and colours each box by how much it grew or shrank, which shows what a swap changed.
The hot function
perf annotate --stdio followed by a function’s name prints that function’s machine instructions from the same perf.data, each beside the share of the function’s samples that landed on it, with source lines between them when debug information is present. It shows which few instructions hold the time: a load that missed, a division, an lfence. One caution applies to every annotation, skid: the interrupt that takes a sample arrives a few instructions after the event that triggered it, so samples pile up just after a slow instruction. The cost of a load that missed lands on the instruction that uses its result, and the cost of lfence and rdtsc on whatever follows them. On Intel, adding :pp to the event (-e cycles:pp) asks the core’s PEBS hardware to record the exact instruction, which narrows the skid.
cargo asm, from cargo install cargo-show-asm, prints what the compiler produced for one function without running anything. It answers questions a profile cannot: whether a function was inlined, in which case it is missing from the list, and whether the hot path holds a call to the allocator or to a panic for a failed bounds check, a lock-prefixed instruction, an atomic read-modify-write of about 20 cycles, or a div of tens of cycles. A profile says where the time is; the assembly says what is there.
The tail is not in the picture
A flame graph counts samples, and samples fall evenly in time, so every box is a share of all the time the thread ran: an average. A p99.9 is one message in a thousand. In a paced run at 100,000 messages a second, the slowest 0.1% are 100 messages a second, and if each lost 5 µs the tail costs 0.5 ms a second, 0.05% of the core: at 4,000 Hz, two samples a second, spread among whatever functions happened to be running. The tail is not hidden in the picture; it is not in it. And while another task had the core, the thread’s cycles did not count and no samples were taken of it: time off the core is invisible to a profiler that samples cycles.
The tail is found by message, not by function, in this order:
- The stage timestamps. The five points already in the loop say in which stage the slow messages were slow: a slow
decodeis the feed thread or the pacing; a slowhopis the strategy not looking, because it was busy, stalled or off its core; a slowthinkis the book or the quoter; a slowout_hopthe gateway. - The worst-100 list. Its sequence numbers say which messages, and their shape says something already: runs of consecutive numbers are a burst or a stall that caught several, scattered singles are individual messages.
- The replay. Run the same file again. If the same sequence numbers are slow, the cause travels with the data or happens at the same point every run, like a first touch, and the slow messages can be timed alone: apply everything before the first of them untimed, then time the next hundred a thousand times over under
perf record, where the tail is now the whole profile. If different numbers are slow each time, the cause is the machine. - The kernel.
perf stat’spage-faults,context-switchesandcpu-migrationson the hot cores, and/proc/interruptsbefore and after, say whether the kernel took the core.perf trace -s -pwith the process id summarises each thread’s system calls, with counts and times, and the hot threads should make none;perf trace --pf=allprints each page fault as it happens, with the address it hit.perf sched recordrecords every scheduling event, andperf sched timehist --cpu=3then lists who ran on core 3 and for how long, so a 40 µs gap in the strategy’s running shows up with the name of whatever had the core.
If nothing in the kernel moved and the slow messages differ from run to run, the core was taken from below the kernel, by a system management interrupt: firmware code the operating system can neither see nor stop, which Intel parts count and turbostat prints in its SMI column.