1 · Memory and the CPU Draft
Core architecture and latency
On this page
1.1 A map of the core
Everything in this chapter happens in one of four places: a front end that fetches and decodes instructions, an out-of-order engine that decides when each one runs, the execution ports that do the work, and the memory hierarchy that feeds them. Chapter 0 named these chapters and walked one instruction through them; this section shows how a modern core actually arranges them. Keep this picture in mind; every later section zooms into one part of it.
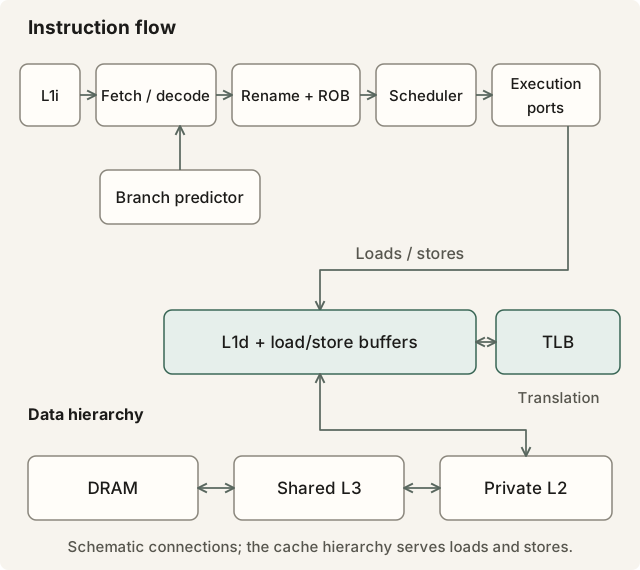
Instruction processing and the memory resources that feed it. Select the diagram to open it at full size.
Instructions flow left to right along the top row. Loads use the data hierarchy below; a miss sends the request to the next level or another core’s cache.
Front end. The core fetches instruction bytes from its L1 instruction cache, 16–32 bytes per cycle, and decodes them into micro-operations (µops), the internal units the rest of the core works with. Fetching runs ahead of execution, so a branch predictor must guess which bytes to fetch next before any branch is resolved; section 1.7 covers what happens when it guesses wrong. A cache of decoded µops lets hot loops skip decoding altogether.
Out-of-order engine. Code can name only 16 general-purpose integer registers (rax to r15) and 16 or 32 vector registers (ymm0–ymm15, or zmm0–zmm31 with AVX-512). Behind those names sits a physical register file of a few hundred entries, and the renamer maps each new result onto a fresh physical register, so two instructions that happen to reuse rax do not have to wait for each other. Renamed µops enter the reorder buffer (ROB) in program order, about 300–500 entries on 2022–2024 cores, wait in a scheduler until their inputs exist, execute in whatever order inputs arrive, and retire in program order so the program never sees the shuffle. That is out-of-order execution. Section 1.6 shows what it buys and where it runs out: the ROB is a window of a few hundred instructions, and a dependency chain or a long miss can exhaust it.
Execution ports. Each cycle the scheduler can send one µop to each of 8–12 ports. Several ports do integer arithmetic, a few do floating-point and vector work, two or three take loads and one or two take stores. Ports set the throughput of a given instruction mix; dependency chains set how much of that throughput you can use.
Memory hierarchy. Loads and stores go through load and store buffers to the L1 data cache, with a TLB beside it translating virtual addresses. A miss goes to the private L2, then the shared L3, then the memory controller and DRAM: section 1.2 has the latencies, section 1.3 how a cache decides what to keep, section 1.5 what happens when two cores want the same line, and section 1.8 what changes when the DRAM is on the other socket. A store can retire before its buffered data becomes globally visible. A full store buffer, an ordering constraint or an ownership delay can still stall the core.
Read more: the Wikipedia article on out-of-order execution is the gentlest entry, and Tomasulo’s algorithm is the 1967 idea underneath it. Fabian Giesen’s A whirlwind introduction to dataflow graphs is the best short piece on thinking in dependency chains. Agner Fog’s microarchitecture manual documents each generation’s front end, ROB size and ports. Henry Wong’s Measuring Reorder Buffer Capacity measures the window from user code, a lab in itself.
1.2 The latency ladder
A processor cannot keep all its data beside its arithmetic units. Fast memory is expensive in die area and power, and it must sit close to the core, because distance is time. So the machine stacks memories in layers, each bigger, cheaper per byte and slower than the one above: registers, a 32–48 KB L1 data cache per core, a 1–2 MB L2 per core, an L3 of tens of megabytes shared by the chip, and DRAM behind a memory controller.
The ladder below is for a typical 2024-era x86 server at 4 GHz. Real parts vary by about a factor of two either way. The last column rescales time so that one cycle lasts one second, which makes the gaps easier to feel.
| Where the data is | Typical size | Latency | Cycles at 4 GHz | If one cycle took one second |
|---|---|---|---|---|
| Register | 16 general-purpose and 16–32 vector registers visible to code; a few hundred physical ones behind them (section 1.1) | 0.25 ns | 1 | 1 s: a heartbeat |
| L1 data cache | 32–48 KB per core | ~1 ns | 4–5 | 4–5 s: reach for a pen on your desk |
| L2 cache | 1–2 MB per core | ~3.5 ns | ~14 | 14 s: find a file in your drawer |
| Branch mispredict (for comparison) | — | ~4–5 ns | 15–20 | 15–20 s: reread a page you misread |
| L3 cache | tens of MB, shared | 10–40 ns | 40–160 | 40 s to 2.5 min: ask the colleague at the next desk (a near L3 slice), or walk to the far end of the floor (a far slice) |
| DRAM, local socket | hundreds of GB | 80–100 ns | 320–400 | 5–7 min: walk to the corner shop |
| DRAM, remote NUMA socket | hundreds of GB | 150–200 ns | 600–800 | 10–13 min: the shop in the next street |
| NVMe SSD read | TB | ~20 µs | ~80,000 | ~22 hours: a day off |
| Network round trip, same data centre | — | 50–500 µs | 200,000–2,000,000 | 2–23 days: a holiday |
| Network round trip, Tokyo–Singapore | — | ~70 ms | ~280,000,000 | ~9 years: primary school |
An L1 hit is about a hundred times cheaper than a DRAM access. The bottom rows matter for colocation and routing; every row from L1 to DRAM is in play on every message.
Why the ladder counts cycles
The third and fourth columns of the ladder say the same thing twice, and when they disagree the cycles column is the one to trust. Three reasons.
The clock moves. A core sold as 4 GHz runs anywhere from under 1 GHz in a power-saving state to 5 GHz in turbo, and it drops under heavy AVX-512 load or heat. An L1 hit is 4–5 cycles on every one of those clocks; in nanoseconds it is anything from 1 to 5. Vendor manuals and Agner Fog’s instruction tables give latencies in cycles for the same reason: cycles make core-local dependencies easier to compare at different clock settings. They still vary across microarchitectures, and DRAM, interconnects and devices have clocks of their own.
Reading a clock costs more than the thing being measured. clock_gettime(CLOCK_MONOTONIC) goes through the vDSO and costs about 20–30 ns. rdtsc, the instruction that reads the CPU’s time-stamp counter, costs about 20–40 cycles (5–10 ns), and it is not ordered with respect to the loads around it, so an ordered timing sequence costs more still. On x86, a common bracket uses lfence; rdtsc; lfence at the start and rdtscp; lfence at the end, with compiler barriers; rdtscp alone does not keep following instructions from starting early. Timing store visibility needs stronger ordering. Bracketing a 4-cycle L1 hit between two clock reads measures the clock reads. Below about 100 ns, count cycles instead: run the operation many times under the hardware counters (perf stat -e cycles) and divide, or infer a latency from a dependent chain as Lab 1.4 does.
The time-stamp counter is not the core clock. Since about 2008 the TSC ticks at a constant nominal rate, the invariant TSC, whatever the core is doing, so rdtsc deltas are reference ticks: convertible to nanoseconds by a fixed factor, but not equal to the cycles the core actually spent. perf’s cycles event counts real core cycles; ref-cycles counts reference cycles while the event is active, subject to the PMU’s definition; unlike elapsed TSC ticks, it is not a wall clock through descheduling or idle.
At the microsecond scale the trade-off flips. A 2 µs wire-to-wire budget is 8,000 cycles, a 25 ns clock read is 1% of it, and nanoseconds are what the exchange, the switch and the network card’s hardware timestamps speak. So the convention in this book: cycles for anything inside the core, nanoseconds at the edges where packets are, and a stated clock frequency whenever one is converted into the other.
Which gap matters most
Each step is roughly 3–8× the one above, but in cycles the steps differ enormously. L1 to L2 adds about 10 cycles. L3 to DRAM adds about 250–300. The absolute size matters because of out-of-order execution, covered in section 1.6 and sketched in the map in section 1.1. A modern core does not stop at an instruction that must wait. It keeps executing later, independent instructions, holding them in a reorder buffer of a few hundred entries. At four instructions per cycle, the buffer fills in roughly 75–125 cycles. A 14-cycle L2 hit vanishes inside that window, and a 40-cycle L3 hit mostly does. A 360-cycle DRAM access does not. The window fills after about 100 cycles, and the core then idles for the remaining 250 or so. How much work overlaps depends on the instruction mix and dependencies; ROB capacity alone is not a fixed latency limit.
If the phrase is new, read the Wikipedia article on out-of-order execution before going on; the map in section 1.1 shows where the reorder buffer sits, and the Further reading list has the deeper sources.
There is one escape. A core can have 10–16 misses in flight at once if their addresses are independent, so ten independent DRAM misses cost little more than one. Ten dependent misses cost ten times as much. That is the difference between reading an array and walking a linked list.
Worked example: one book update, three cache lines
A “modify order” message carries an order reference and a new quantity. The book handler does three things with it.
First, it looks up the order to find its price and side. The table holds three million resting orders, and this one has been idle for seconds, so its record is in DRAM: about 90 ns. Second, it finds the price level, 30 ticks behind the best bid, last touched 2 ms ago. It has left L1 and L2 but is still in L3: say 25 ns. Third, it reads the top-of-book record, which every message touches, so it is in L1: about 1 ns.
The first two steps form a dependency chain: the handler cannot know which level to visit until the order record arrives. Total memory time is about 90 + 25 + 1 = 116 ns. The arithmetic adds perhaps 10–15 ns. Memory is about 90% of the cost.
Against a 1 µs budget, 116 ns looks affordable. But one packet in a busy burst often carries several messages, and six of these cost about 700 ns before the quoting logic runs. The fix is not faster arithmetic. It is a layout that keeps the order record on-chip, or issuing all six lookups up front so their misses overlap.
Reading your own machine
Start with what your machine reports about itself.
Recent versions of lscpu print cache totals and instance counts; divide to find the size of each instance. For example, a 32-core part might have 48 KiB of L1d and 2 MiB of L2 per core, and a 60 MiB L3 shared by a group of cores. getconf -a | grep CACHE gives cache parameters too. In sysfs, read /sys/devices/system/cpu/cpu0/cache/index*/{level,type,size,ways_of_associativity,coherency_line_size,shared_cpu_list} to see which caches CPU 0 uses.
Each index* directory also holds shared_cpu_list, naming the cores that share that cache. On AMD parts, where an L3 serves only one eight-core chiplet, it tells you which cores can exchange data cheaply. Inside a VM, these files show whatever the hypervisor advertises.